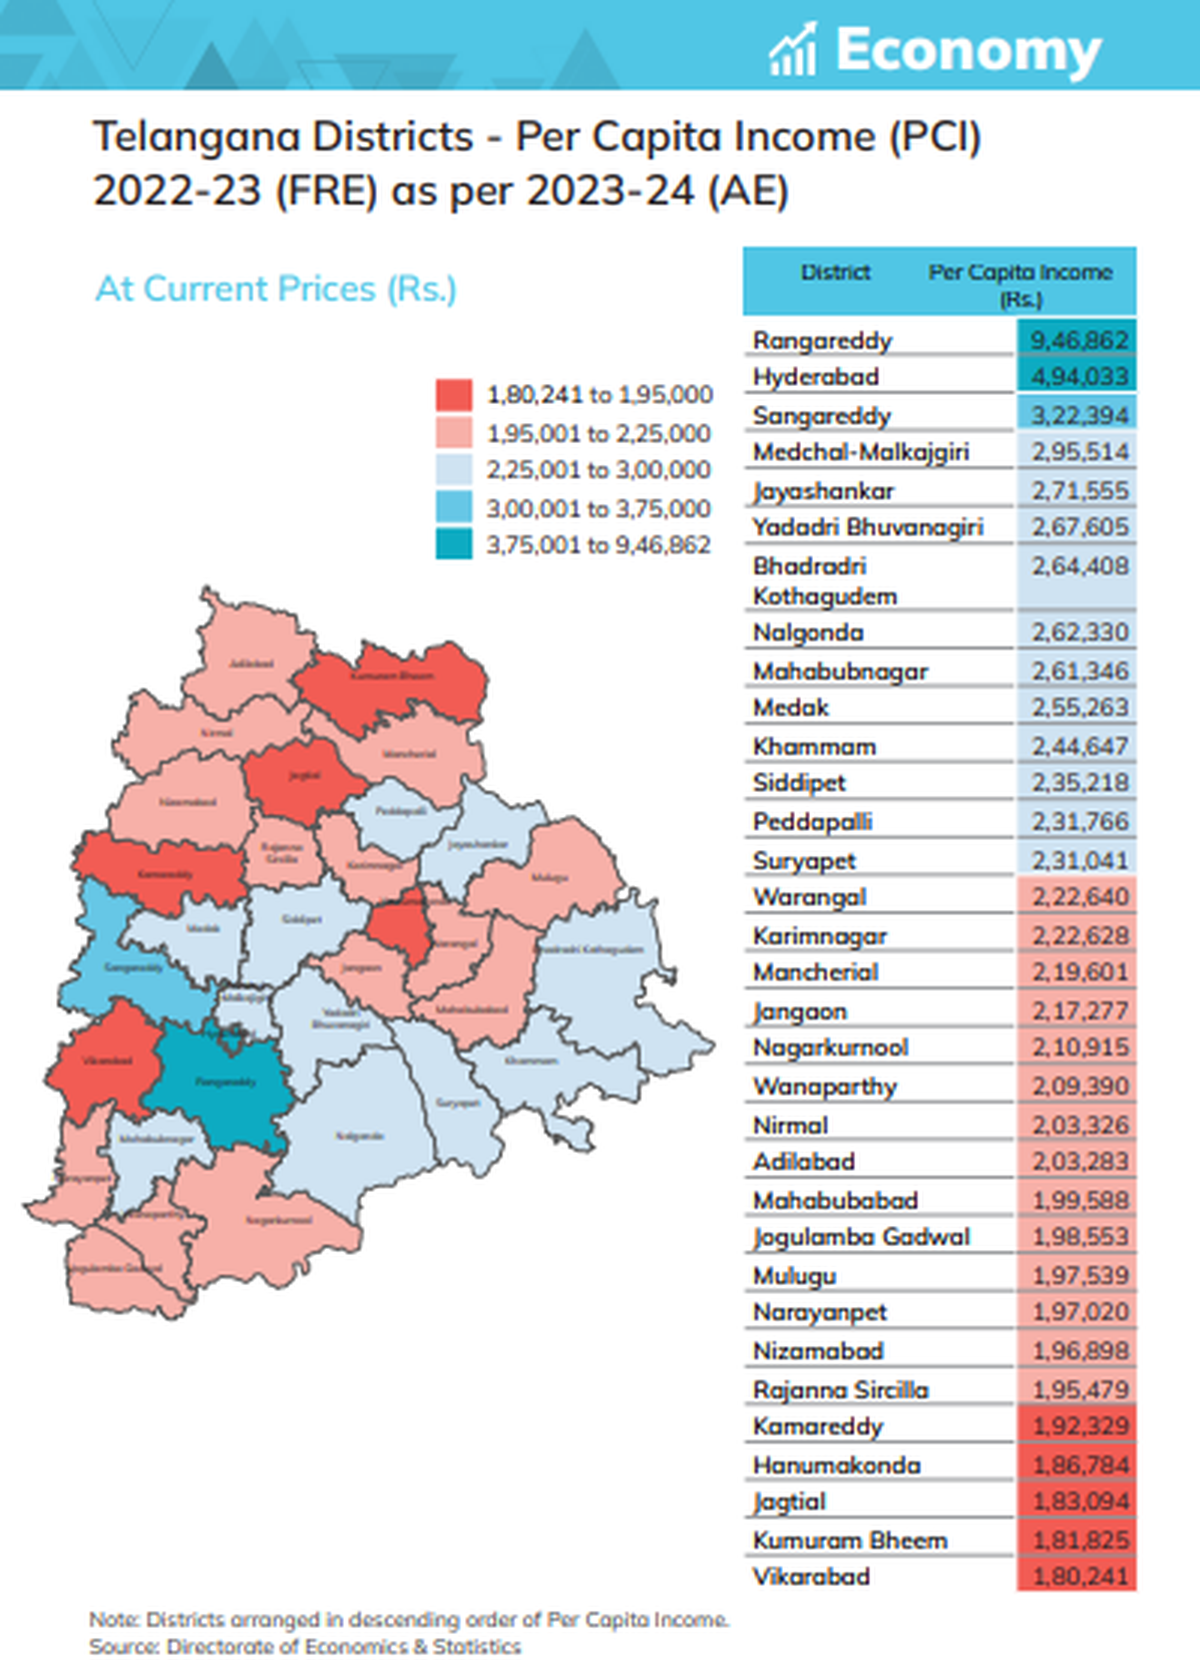
Directorate of Economics and Statistics recently released the report on Telangana Economy, with details on Gross State Domestic Product (GSDP), Gross District Domestic Product, Per Capita Income and other economic parameters of the State.
| Photo Credit: By Arrangement
There is wide disparity among the districts in Telangana in terms of Gross State Domestic Product (GSDP) and Per Capita Income (PCI).
Per Capita Income
A comparison of the Gross District Domestic Product (GDDP) and PCI reveals the sharp differences among the districts in the two vital economic parameters pertaining to their financial health. Rangareddy district has the highest PCI of ₹9.46 lakh at current prices when compared with ₹1.8 lakh of Vikarabad. Hyderabad district has the next highest PCI of ₹4.94 lakh and Sangareddy ₹3.22 lakh while per capita income of all other districts is ranging between ₹1.8 lakh to ₹2.9 lakh.

GDDP
In terms of GDDP too, Rangareddy is at the top with ₹2.83 lakh crore as compared with Mulugu district which has GDDP of ₹6,914 crore. Except for Hyderabad (₹2.28 lakh crore) and Medchal-Malkajgiri (₹88,867 crore), the GDDP of all other districts is below ₹61,000 crore.
GSDP
These figures are revealed in the provisional estimates of 2023-24 of the State’s economy released by the Directorate of Economics and Statistics recently. According to the report, the GSDP of the State increased from ₹13.11 lakh crore in 2022-23 to ₹15.01 lakh crore in 2023-24 (preliminary estimates).
What is GSDP?
GSDP/GDP is the value of all the final goods (e.g. cars, food, furniture) and services (e.g. services provided by barbers, taxi drivers, waiters) produced within the state’s boundaries in a specific time period (usually a year).
What is its significance?
It is a comprehensive scorecard of a state’s economic health, and can be used to estimate the size of the economy, and its growth rate. GSDP/GDP helps policymakers, investors, and businesses make decisions by understanding an economy’s health. When GDP is growing, workers and businesses are generally better off than when it is not.
The economic growth rate however is estimated to decline from 16.7% to 14.5% during the period. Telangana is better placed in economic growth rate as compared with the national GDP growth which is expected to decline from 14.2% to 9.6%. “The decline in growth rate at the national level is much sharper than that in Telangana. In comparison to India GDP growth rate, Telangana State growth rate is higher by 4.9 points,” the report said.
The same is the case with PCI which is estimated at ₹3.56 lakh in 2023-24 as against ₹3.12 lakh in the previous year. The growth rate however reflected a decrease from 16.2% in 2022-23 to 14.1% in 2023-24. The national PCI during the same period is expected to increase from ₹1.69 lakh to ₹1.84 lakh, but the decline in growth rate reflected a sharp decline from 12.3% in 2022-23 to 8.7% in 2023-24.
What is Per Capita Income (PCI)
Per Capita Income (PCI) is the metric for determining a state’s economic output or average income for each person residing within the state. It measures the amount of money that would be available per person if the total value of all goods and services produced in the economy were to be divided equally among all citizens.
What is its significance?
Per Capita Income is often used as a measure of the standard of living in a state.


